1. Standard plot() 출력
cerebro = bt.Cerebro() # stdstats (default: True)로 되어있음.
...
cerebro.run()
cerebro.plot()
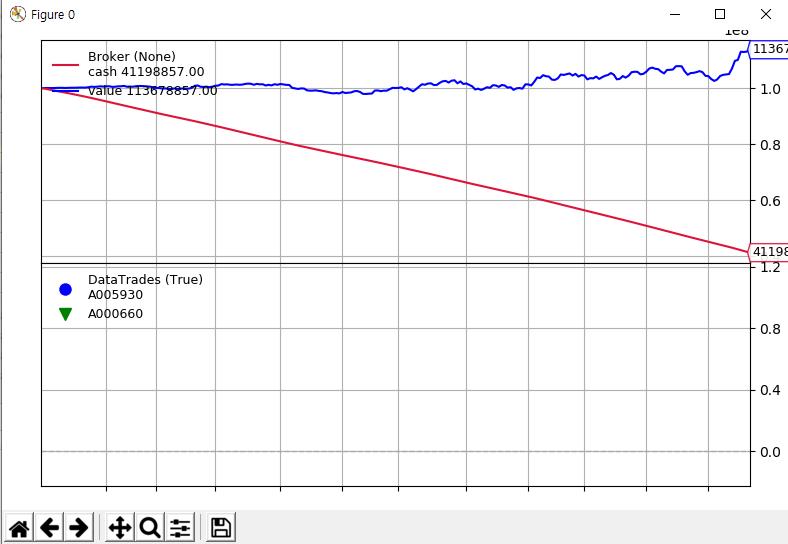
위와 같이 cerebro생성 이후 plot()를 실행하면 기본적으로 아래와 같이 Broker, Data Trades, BuySell 3개의 그래프가 출력된다. 그 이유는 표준에는 묵시적으로 아래 3개의 observers가 추가되어있기 때문이다.
cerebro.addobserver(bt.observers.Broker)
cerebro.addobserver(bt.observers.Trades)
cerebro.addobserver(bt.observers.BuySell)

2. stdstats False 처리
cerebro = bt.Cerebro()
...
cerebro.run(stdstats=False)
cerebro.plot()
stdstats를 false처리하면 아래와 같이 가장 중요한 BuySell그래프만 출력됨. 아마도 Data를 기반으로 출력되는 Main이기 때문에 아래 그래프만 남은 것으로 보이며, Data를 기반으로 하는 SMA등의 indicator를 추가하면 BuySell은 사라짐.

3. data에 plotinfo.plot False처리
data = bt.feeds.PandasData(dataname=df,
# datetime='Date',
nocase=True,
)
data.plotinfo.plot = False
cerebro.addstrategy(TestStrategy)
cerebro.adddata(data,name = j)
data feed전에 생성된 data의 plotifo.plot를 False처리하면 데이터를 기반으로 하는 BuySell그래프가 사라짐.

4. 위 2가지를 모두 적용하여 기존 standard 3개 observers를 없애고, Broker observers를 추가
cerebro.addobserver(bt.observers.Broker)
그러면 아래 그림고 같ㅇ Broker 그래프만 존재하게 됨.

'Language > python' 카테고리의 다른 글
| 날짜 계산 (1) | 2020.01.15 |
|---|---|
| [ Python backtrader ] backtrader 참고 사이트 (0) | 2020.01.14 |
| [ Python backtrader ] plot option (0) | 2020.01.14 |
| [ Python library ] argparse 사용법 (0) | 2020.01.14 |
| [ Python backtrader ] Multi 기본 하루 1주 매수전략 (0) | 2020.01.14 |